• Skip to primary navigation
  • Skip to main content
  • Skip to primary sidebar
  • Skip to footer
Ghior.Com

Ghior.Com

Free Essays, Compositions, Paragraphs Etc.

  • Home
  • Essays
  • Compositions
  • Paragraphs
  • Letters
  • Applications
  • Dialogues
  • Story
  • All Categories

Describe and Analyze the Graph of The Average Temperatures of The Year in Some Cities in Bangladesh

Question: The graph below shows the average temperatures of the year in some cities in Bangladesh. Describe and analyze it.

Describe and Analyze the Graph of The Average Temperatures of The Year in Some Cities in Bangladesh
Graph of Average temperatures of the year in Celsius

Average temperatures of the year in Celsius

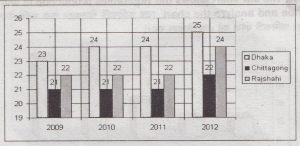
Answer: The graph shows the average temperatures of different years in the three cities; Dhaka, Chittagong, and Rajshahi. In the year 2009, the temperature of Dhaka is higher than either of the two cities. In this year the temperature in Dhaka is 23 c while it is 21 c in Chittagong and 22c in Rajshahi. Over the years the temperatures have increased in all these cities. It is noticeable that Dhaka’s temperature always remains higher than either of the cities. In 2010 the temperatures of Rajshahi and Chittagong remain the same as the previous years but it is one degree higher in Dhaka. The same trend is also noticeable in 2011 when Dhaka’s temperature is one degree increased while it is the same in the other two cities. In 2012 temperatures in Chittagong and Rajshahi are increased by one degree than the previous year. Dhaka’s temperature is always in the increase. According to the chart, the temperature in Dhaka is increased by one degree every year while the same increase does not occur in the case of Rajshahi and Chittagong.

Related posts:

  1. Describing the Graph of The Average Temperatures of The Year
  2. Describing the Graph of Mobile Phone Users in Bangladesh
  3. Describing the Graph of Literacy Rate of Bangladesh from 1995-2010
  4. Describing the Graph of Yearly Imports and Exports
  5. Describing the Graph of Literacy Rate of Bangladesh
  6. Describing the Graph of The Arrival of Tourists from Different Countries

Filed Under: Graphs and Charts

Primary Sidebar

Categories

  • ►Applications
    • General Applications
    • Job Applications
    • Leave Applications
  • Compositions
  • Dialogues
  • Essays
  • ►Grammar
    • Tense
  • Graphs and Charts
  • ►Letters
    • Acceptance Letters
    • Advice Letters
    • Congratulations Letter
    • Cover Letters
    • Emails
    • General Letters
    • Increment Letter
    • Inquiry Letters
    • Invitation Letters
    • Job Confirmation Letter
    • Job Offer Letters
    • Request Letters
    • Resign Letters
    • Thank You Letters
  • Paragraphs
  • Reports
  • Story
  • Writing Help

Footer

About

  • About
  • All Posts
  • All Categories
  • Site Map

Legal

  • Privacy Policy
  • Terms of Service
  • Disclaimer
  • Copyright

Help and Support

  • FAQ
  • Contact Us

Follow Us!

  • Facebook
Copyright © 2019 · Ghior.Com, All Rights Reserved.
We use cookies to ensure that we give you the best experience on our website. If you continue to use this site we will assume that you are happy with it.OkPrivacy policy